Learning how to read nutrition facts labels transforms grocery shopping from guesswork into informed decision-making. This guide is designed for busy families, health-conscious shoppers, and anyone who wants to make better food choices without spending hours researching every product.
The nutrition facts label contains valuable information, but many people find it confusing or overwhelming. You’ll discover how to decode the key components of the nutrition panel, including serving sizes and daily value percentages. We’ll also cover how to master macronutrient information so you can balance proteins, carbs, and fats based on your health goals.
Finally, you’ll learn practical shopping strategies that help you compare products quickly and avoid the common mistakes that can derail your nutrition plans.
Decode Key Components of the Nutrition Facts Panel
Locate serving size information to calculate accurate nutrient intake
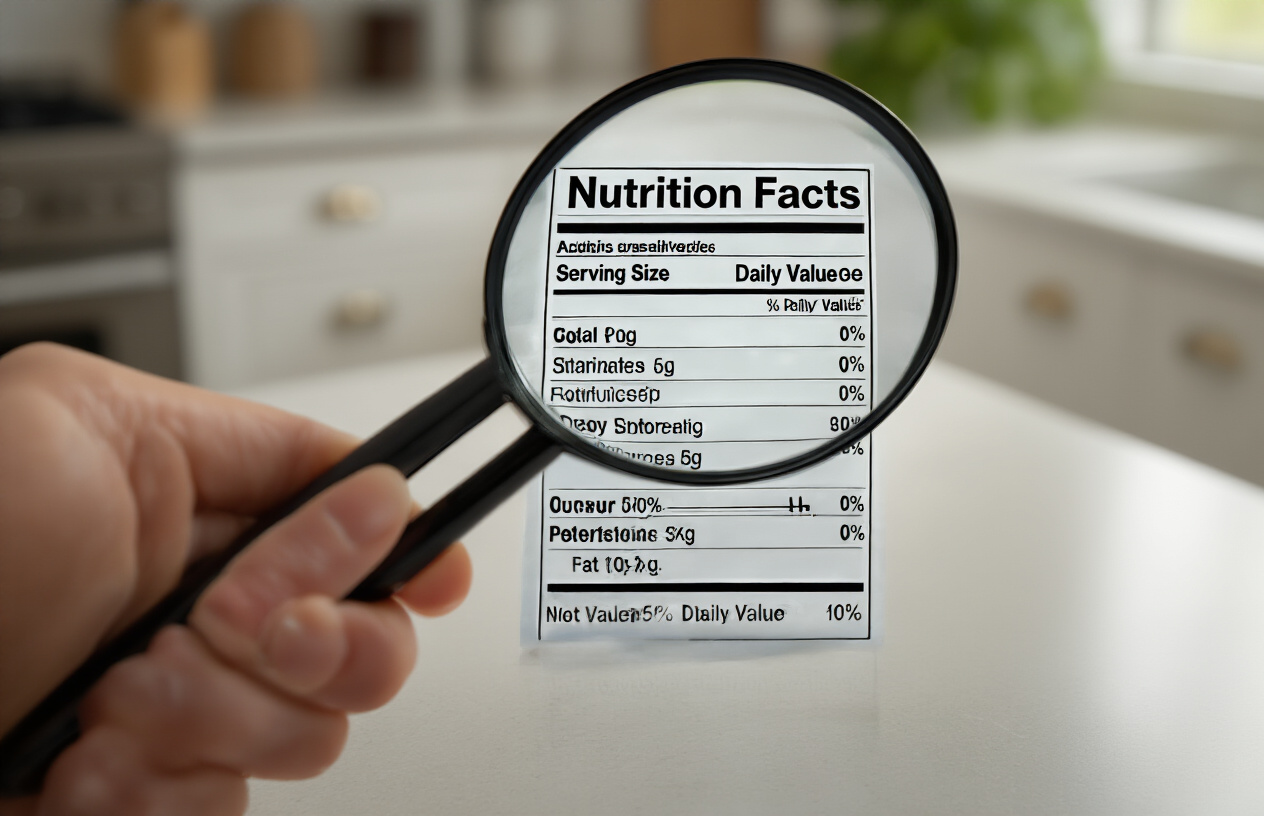
The serving size sits at the very top of every nutrition label, and it’s your baseline for everything else on that panel. This number tells you exactly how much food the nutritional information represents. You’ll see it listed in familiar measurements like cups, pieces, or grams, followed by the metric weight in parentheses.
Many people skip right past this crucial detail, but here’s the thing – all those numbers below only make sense when you know the serving size. If the label says one serving equals half a cup but you’re eating a full cup, you need to double every single number on that label.
The FDA standardized serving sizes to reflect what people actually eat, not necessarily what they should eat. A serving of ice cream is two-thirds of a cup, while a serving of breakfast cereal ranges from three-quarters to one and one-third cups depending on the type. These aren’t random numbers – they’re based on national food consumption surveys.
Pay attention to “servings per container” too. That innocent-looking bottle of juice might contain 2.5 servings, meaning you’re getting 2.5 times the calories and sugar if you drink the whole thing. Smart shoppers always check both the serving size and servings per container before making quick mental calculations about nutritional content.
Interpret calorie counts for effective portion control
Calories represent the energy your body gets from food, and they’re listed prominently right below the serving size. This number tells you exactly how much energy you’re consuming per serving – not per package or per “eyeballed” portion.
The calorie count becomes your portion control compass. If you’re tracking your daily intake, you can quickly determine if a food fits your goals. A snack with 250 calories per serving might work perfectly for an afternoon treat, but if you’re eating three servings without realizing it, you’ve just consumed 750 calories.
Food manufacturers are required to round calories to the nearest 5-calorie increment, so 127 calories becomes 125 on the label. Foods with fewer than 5 calories per serving can legally claim “0 calories,” which explains why some diet sodas and sugar-free gums show zero despite containing small amounts of calories.
Different macronutrients provide different calorie amounts per gram. Carbohydrates and protein each provide 4 calories per gram, while fat provides 9 calories per gram. Alcohol adds 7 calories per gram. Understanding this breakdown helps explain why fatty foods pack more calories into smaller portions.
Understand percent daily values for informed dietary choices
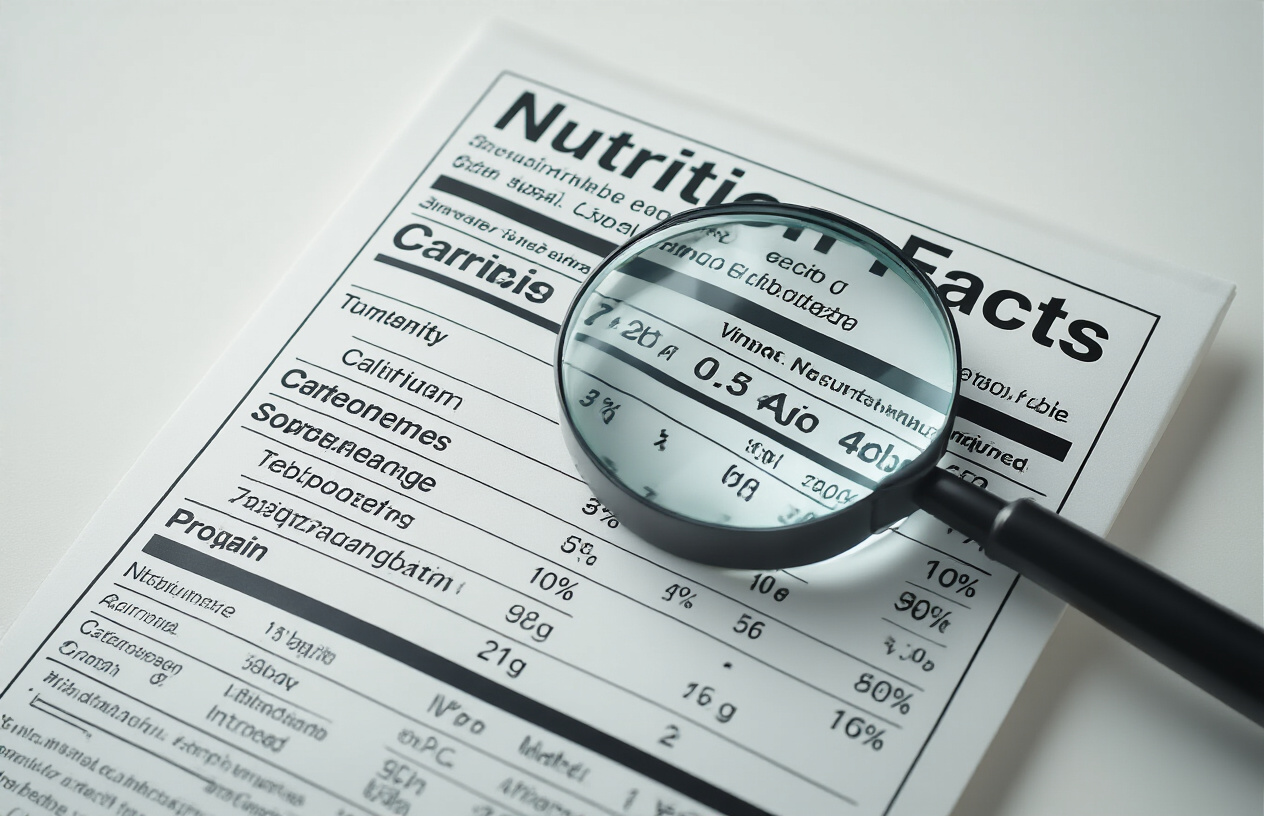
Percent Daily Values (%DV) appear on the right side of the nutrition label and show how much one serving contributes to your daily nutritional needs. These percentages are based on a 2,000-calorie diet, which serves as the standard reference point for most adults.
The %DV system makes comparing products incredibly simple. If Product A has 15% DV for fiber and Product B has 8% DV for fiber, you immediately know which one provides more fiber per serving. You don’t need to understand grams or do mental math – the percentage does the work for you.
Here’s a practical rule: 5% DV or less is considered low for any nutrient, while 20% DV or more is considered high. This applies whether you want more of something (like fiber, vitamins, or minerals) or less of something (like saturated fat or sodium). A food with 25% DV for vitamin C provides a substantial amount, while something with 3% DV provides very little.
| %DV Range | Classification | Application |
|---|---|---|
| 0-5% | Low | Good for nutrients you want to limit |
| 6-19% | Moderate | Reasonable contribution to daily needs |
| 20%+ | High | Excellent source of beneficial nutrients |
Remember that %DVs add up throughout your day. If your breakfast cereal provides 25% DV for iron and your lunch spinach salad provides another 15% DV, you’re already at 40% of your daily iron needs by mid-afternoon.
Some nutrients don’t have established daily values yet, including added sugars (which got %DV in 2020) and trans fats. When you see a nutrient without a %DV, you’ll need to evaluate it using other knowledge about recommended limits or beneficial amounts.
Master Macronutrient Information for Better Health Decisions
Evaluate total fat content and identify healthy fat sources
Total fat on nutrition labels tells only part of the story. The magic happens when you look deeper at the types of fat listed below the main fat content. Saturated fats should stay under 10% of your daily calories, while trans fats deserve a hard pass whenever possible – even small amounts can mess with your cholesterol levels.
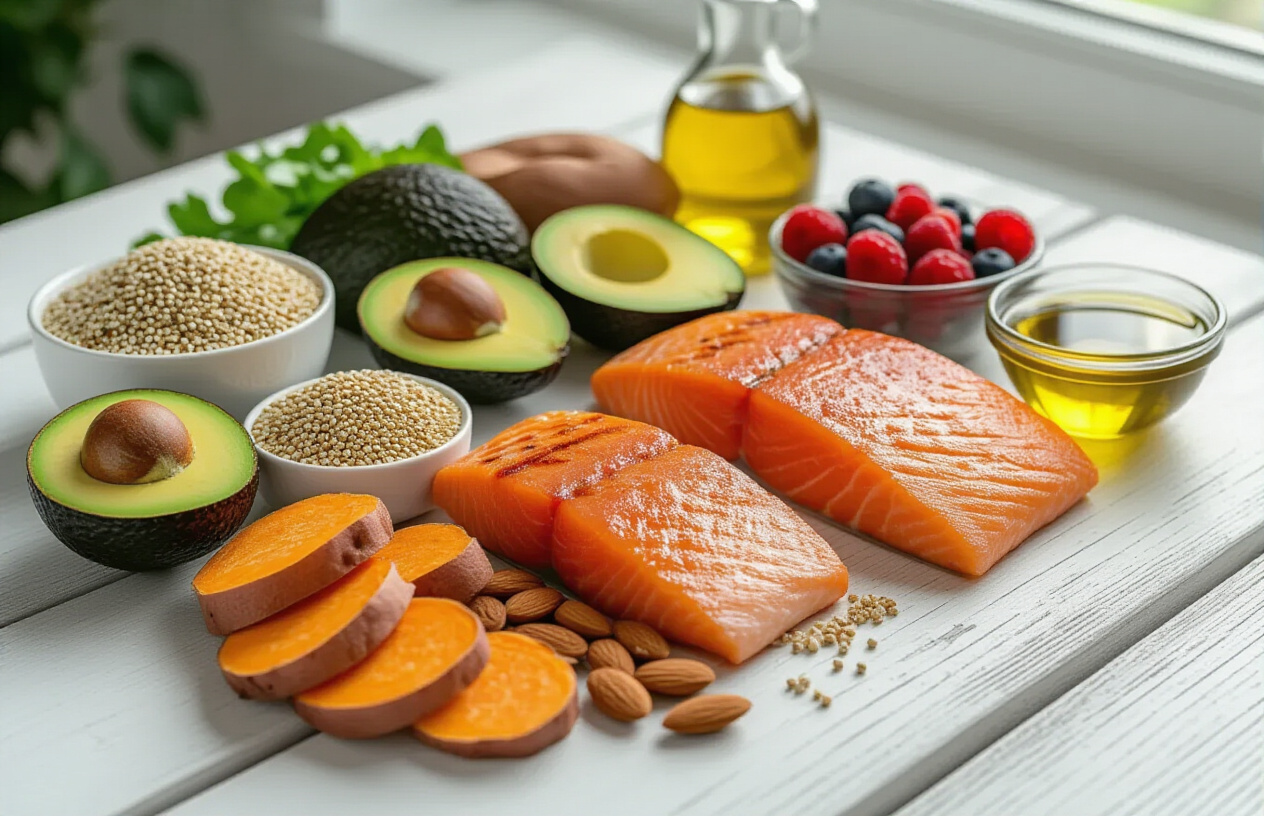
Your body actually needs healthy fats to function properly. Look for products rich in monounsaturated and polyunsaturated fats, though these aren’t always broken down on labels. Check the ingredient list for clues: olive oil, avocados, nuts, and seeds signal good fat sources. Fish oils and flaxseeds bring omega-3 fatty acids to the table.
When comparing similar products, don’t just grab the “low-fat” version automatically. Sometimes manufacturers replace healthy fats with sugar or refined carbs, making the supposedly healthier option worse for you overall.
Assess carbohydrate levels including fiber and added sugars
Carbohydrates get broken down into total carbs, dietary fiber, and sugars on nutrition labels. Total carbs include everything – fiber, natural sugars, and added sugars combined. This number matters most if you’re managing diabetes or following a specific eating plan.
Fiber deserves special attention since most people don’t get enough. Women need about 25 grams daily, while men should aim for 38 grams. High-fiber foods keep you full longer and support digestive health. Look for products with at least 3 grams of fiber per serving.
Added sugars now get their own line on labels, separate from naturally occurring sugars in fruits or milk. The American Heart Association recommends limiting added sugars to 6 teaspoons daily for women and 9 for men. Watch out for sneaky sugar sources in seemingly healthy foods like yogurt, granola bars, and pasta sauce.
Determine protein quality and quantity for your needs
Protein requirements vary based on your activity level, age, and health goals. Most adults need about 0.8 grams per kilogram of body weight daily, but active individuals might need 1.2-2.0 grams per kilogram. A 150-pound person should get roughly 55-110 grams daily depending on their lifestyle.
Complete proteins contain all nine essential amino acids your body can’t make on its own. Animal products like meat, fish, eggs, and dairy provide complete proteins. Plant proteins from beans, quinoa, and soy also offer complete amino acid profiles, while other plant sources might need combining with complementary foods.
Quality matters as much as quantity. Lean proteins deliver the goods without excess saturated fat. Greek yogurt, chicken breast, fish, and legumes pack protein efficiently. Processing affects protein quality too – whole foods generally beat protein powders and bars for overall nutrition value.
Recognize sodium levels to manage blood pressure
Sodium content often shocks people when they start reading labels carefully. The daily limit sits at 2,300 milligrams for most adults, with 1,500 milligrams being even better for blood pressure management. That sounds like a lot until you realize one teaspoon of salt contains about 2,300 milligrams.
Processed and packaged foods contribute most dietary sodium – not the salt shaker on your table. Bread, pizza, sandwiches, cold cuts, and soup rank among the biggest sodium sources in typical diets. Even foods that don’t taste particularly salty can pack surprising amounts.
Compare sodium levels between brands and choose lower-sodium options when available. Foods with less than 140 milligrams per serving qualify as “low sodium,” while anything over 400 milligrams per serving counts as high. Your taste buds adapt to lower sodium levels within a few weeks, making less salty foods taste normal again.
Navigate Vitamin and Mineral Content Effectively
Identify Essential Vitamins That Support Immune Function
Vitamin C stands as the superstar of immune support, and the nutrition label shows exactly how much you’re getting. Look for foods providing at least 90mg for men and 75mg for women daily. Citrus fruits, bell peppers, and strawberries pack impressive amounts, often exceeding 100% of your daily value in a single serving.
Vitamin D deserves equal attention, especially since many people run low on this sunshine vitamin. The label lists it in both micrograms and International Units (IU). Adults need about 600-800 IU daily, making fortified milk, cereals, and fatty fish valuable choices. During winter months, checking labels for vitamin D becomes even more critical.
Vitamin A appears on labels in two forms: preformed vitamin A from animal sources and beta-carotene from plants. Both support immune cell function, but your body converts beta-carotene as needed. Sweet potatoes, carrots, and leafy greens often provide over 100% daily value in reasonable portions.
B vitamins, particularly B6, B12, and folate, keep your immune system running smoothly. B6 helps produce antibodies, while B12 supports white blood cell formation. Folate aids in creating new immune cells. Animal proteins excel in B12, while fortified grains and legumes provide B6 and folate.
Recognize Important Minerals for Bone and Muscle Health
Calcium tops the mineral priority list for bone strength, with adults needing 1,000-1,200mg daily. Nutrition labels make it easy to track calcium intake, showing both milligrams and percentage daily value. Dairy products, fortified plant milks, and leafy greens deliver substantial amounts. Three servings of calcium-rich foods typically meet daily needs.
Magnesium works alongside calcium but gets less attention despite being equally important. This mineral supports over 300 enzyme reactions, including those building bone tissue and enabling muscle contractions. Nuts, seeds, and whole grains provide generous amounts, though processing often strips magnesium away.
Iron keeps muscles functioning by delivering oxygen through your bloodstream. The label shows iron content, but remember that plant-based iron (non-heme) absorbs less efficiently than iron from meat sources (heme iron). Pairing iron-rich plant foods with vitamin C enhances absorption significantly.
Potassium maintains proper muscle and nerve function while supporting bone health indirectly by reducing calcium loss. Most Americans fall short of the 3,500mg daily recommendation. Bananas get the spotlight, but potatoes, tomatoes, and beans actually provide more potassium per serving.
Zinc supports bone formation and muscle repair, with needs varying by age and gender. Meat, seafood, and legumes provide reliable sources, though vegetarians should pay closer attention to zinc intake since plant sources offer lower bioavailability.
Compare Nutrient Density Across Different Food Options
Smart shoppers compare nutrient density by examining vitamins and minerals per calorie rather than just total amounts. A medium orange provides 70mg of vitamin C for only 60 calories, while orange juice delivers similar vitamin C but doubles the calories. The whole fruit wins for nutrient density.
Leafy greens demonstrate exceptional nutrient density across multiple vitamins and minerals. One cup of raw spinach provides substantial folate, vitamin K, and iron for fewer than 10 calories. Compare this to iceberg lettuce, which offers minimal nutrients for similar calories, and the difference becomes clear.
When comparing protein sources, consider the mineral bonus each provides. Lean beef delivers iron, zinc, and B vitamins, while salmon adds vitamin D and omega-3s. Beans provide iron and folate but require vitamin C-rich foods for optimal iron absorption. Each choice offers unique advantages depending on your nutritional priorities.
Fortified foods can boost nutrient density significantly. Fortified cereals often provide 100% daily value for multiple B vitamins, iron, and sometimes vitamin D. However, check sugar content to ensure you’re not trading nutrient benefits for empty calories.
Reading labels side-by-side reveals surprising differences. Greek yogurt typically contains twice the protein and more calcium than regular yogurt in similar serving sizes. Comparing different brands of the same food type often shows significant variation in vitamin and mineral content, making label reading essential for maximizing nutritional value.
Apply Label Knowledge to Smart Shopping Strategies

Compare similar products to find the healthiest options
Side-by-side comparisons reveal which products truly deserve space in your cart. Place two similar items together and scan their nutrition labels systematically. Start with serving sizes—brands often manipulate these to make their numbers look better. A cereal claiming 110 calories might use a ¾ cup serving while its competitor uses 1 cup.
Focus on the nutrients that matter most for your health goals. If you’re watching sodium, compare milligrams per serving across brands. For heart health, check saturated fat content. When comparing bread, look beyond “whole grain” claims on the front and examine the fiber content—real whole grain products typically contain at least 3 grams per slice.
Create a simple scoring system for products you buy regularly. Rate items on a scale of 1-5 across categories like protein, fiber, added sugars, and sodium. The brand with the highest total score wins your purchase. This method works especially well for packaged foods like yogurt, crackers, and frozen meals where nutritional quality varies dramatically between brands.
Spot misleading marketing claims versus actual nutritional value
Front-of-package claims often paint a rosier picture than the nutrition facts support. “Natural” appears on foods loaded with sodium and sugar because these ingredients technically occur in nature. “Made with whole grains” might mean wheat flour is the fifth ingredient, buried behind refined flour, sugar, and preservatives.
Look past feel-good buzzwords and examine actual numbers. A granola bar boasting “12g protein!” loses its appeal when you discover it also contains 18g sugar and minimal fiber. Energy drinks claiming “natural caffeine” still deliver the same jittery effects as synthetic versions.
Pay special attention to serving size manipulation. Trail mix packages might list impressive protein and healthy fat numbers, but closer inspection reveals the serving size covers just a handful of nuts—unrealistic for most people’s actual consumption patterns.
| Marketing Claim | What to Check on Label | Red Flags |
|---|---|---|
| “Low Fat” | Total fat grams | High sugar content |
| “High Protein” | Protein per serving | Excessive sodium |
| “Natural” | Ingredient list | Long list of additives |
| “Whole Grain” | Fiber content | Less than 3g per serving |
Calculate cost per nutrient to maximize your grocery budget
Smart shoppers think beyond price per pound and consider nutritional value per dollar spent. Calculate cost per gram of protein by dividing the product price by total protein grams. This reveals that dried beans often deliver protein more affordably than meat, while Greek yogurt beats protein bars hands down.
For vitamins and minerals, compare the percentage daily value against cost. A $2 orange provides 100% daily vitamin C, while a $15 supplement bottle might offer the same amount per serving over 30 days. Fresh produce frequently wins this calculation, especially when seasonal items go on sale.
Track cost per nutrient for your staple foods using a simple spreadsheet. Include protein, fiber, calcium, iron, and vitamins A and C. Update prices when you shop to identify the best deals. You’ll quickly discover that oatmeal delivers more bang for your buck than fancy breakfast cereals, and frozen vegetables often outperform fresh ones in both nutrition and cost effectiveness.
Build balanced meals using nutrition label insights
Transform nutrition labels into meal-planning tools by thinking in complementary combinations. Pair foods that balance each other’s nutritional profiles. Brown rice lacks complete proteins, but adding black beans creates a nutritionally complete combination. The rice provides lysine while beans supply methionine.
Use the 25% rule for balanced plates: aim for foods that provide at least 25% daily value of different nutrients. A sweet potato gives you vitamin A, spinach delivers folate and iron, and salmon provides omega-3s and protein. This approach ensures you’re not getting all your nutrients from just one or two foods.
Plan weekly menus by mapping nutrients across meals. If breakfast is light on protein, make lunch protein-heavy. When dinner includes high-sodium items, keep other meals lower in salt. This balancing act becomes second nature once you start reading labels with meal planning in mind.
Consider nutrient timing throughout your day. Foods high in fiber work well at breakfast to keep you satisfied, while lean proteins shine at lunch for sustained afternoon energy. Reading labels helps you identify which foods support your daily rhythm and energy needs.
Avoid Common Label Reading Mistakes That Impact Your Health
Recognize hidden sugars in unexpected food categories
Sugar lurks in places you’d never suspect, making label reading a detective game worth mastering. Salad dressings, pasta sauces, and yogurts often contain surprising amounts of added sugars that can derail healthy eating goals. Even seemingly innocent items like bread, crackers, and granola bars frequently pack sugar levels comparable to candy.
The sneakiest culprits hide behind clever names. Food manufacturers use over 60 different terms for sugar, including high fructose corn syrup, maltodextrin, dextrose, cane juice, and fruit juice concentrate. Brown rice syrup, coconut sugar, and agave nectar might sound healthier, but your body processes them similarly to regular sugar.
Common sugar hideouts include:
- Condiments (ketchup, barbecue sauce, teriyaki sauce)
- Breakfast foods (cereals, instant oatmeal, muffins)
- Savory snacks (flavored nuts, protein bars)
- Beverages (sports drinks, flavored water, coffee creamers)
- Frozen meals and soups
Watch ingredient lists carefully – ingredients appear in descending order by weight. When sugar appears in multiple forms throughout the list, the total sugar content can be substantial even when no single sugar source dominates.
Understand the difference between natural and artificial ingredients
Natural doesn’t automatically mean better for your health, despite clever marketing that suggests otherwise. The FDA defines “natural” flavors as substances extracted from plants, animals, or minerals, while “artificial” flavors are chemically synthesized. Both undergo processing and can be identical at the molecular level.
Natural vanilla flavor comes from vanilla beans, while artificial vanilla uses vanillin created in labs. Your taste buds and digestive system can’t tell the difference between these chemically identical compounds. Sometimes artificial versions are actually purer than their natural counterparts, which may contain allergens or inconsistent flavor profiles.
The real concern isn’t whether ingredients are natural or artificial – it’s their overall impact on your health. A natural sugar is still sugar, and natural preservatives can still cause reactions in sensitive individuals. Focus on the bigger picture: whole foods with minimal processing typically offer better nutrition than heavily processed items, regardless of whether their ingredients are labeled natural or artificial.
Key considerations:
- Natural doesn’t equal nutritious or safe
- Both natural and artificial additives undergo safety testing
- Whole, minimally processed foods remain your best choice
- Individual sensitivities matter more than ingredient origin
Identify when low-fat claims mask high sugar content
Food manufacturers often compensate for removed fat by adding sugar to maintain taste and texture, creating products that seem healthier but can actually be worse for your metabolism. Low-fat cookies, crackers, and dairy products frequently contain significantly more sugar than their full-fat versions.
Fat provides flavor and satisfaction, so when it’s removed, sugar steps in to fill the gap. This swap can leave you feeling less satisfied after eating, leading to overconsumption. Your body also processes these high-sugar, low-fat foods differently, potentially causing blood sugar spikes followed by crashes that trigger more cravings.
Compare labels side by side to spot this trick. A low-fat yogurt might contain 20 grams of sugar compared to 8 grams in the regular version. Low-fat salad dressings often replace oil with corn syrup or other sweeteners, dramatically increasing the carbohydrate content.
Red flags to watch for:
- Sugar appears in the first five ingredients on low-fat products
- Total carbohydrates are higher in low-fat versions
- Ingredient lists are longer in reduced-fat items
- Multiple sugar sources in one product
Smart shoppers read beyond marketing claims on the front of packages. The nutrition facts panel tells the real story about what you’re actually consuming, helping you make decisions based on complete nutritional information rather than selective marketing messages.
Reading nutrition labels doesn’t have to be rocket science once you know what to look for. By focusing on serving sizes, understanding how carbs, proteins, and fats work together, and paying attention to essential vitamins and minerals, you can make grocery shopping a whole lot smarter. Those little panels packed with numbers actually tell the story of what you’re putting in your body, and now you have the tools to decode that story.
The next time you’re at the store, flip that package over and give the label a real look. Skip the marketing claims on the front and dig into the facts on the back. Your future self will thank you for taking those extra few seconds to check if that “healthy” snack is actually as good as it sounds. Small changes in how you read labels can lead to big improvements in how you feel every day.